> ## Documentation Index
> Fetch the complete documentation index at: https://prismeai-legacy.mintlify.site/llms.txt
> Use this file to discover all available pages before exploring further.
# Execution & Activity
> Learn how to monitor, debug, and optimize tool execution in Prisme.ai agents using Activity tracking and event management
Understanding how tools execute and monitoring their performance is critical for developing reliable tool-using agents. Prisme.ai provides powerful Activity tracking capabilities that give you visibility into every aspect of tool execution, from request processing to result delivery.
## The Value of Activity Tracking
Activity tracking in Prisme.ai provides:
Complete transparency into how tools execute
Powerful debugging for error resolution
Performance metrics and usage patterns
Comprehensive audit trails of all operations
Real-time observation of system behavior
Data-driven insights for performance improvements
## Understanding the Event System
At the core of Prisme.ai's Activity tracking is its event-driven architecture:
### Key Components
Structured messages representing actions, status changes, or notifications
**Key attributes**:
* Event type
* Timestamp
* Source identifier
* Payload data
* Request context
Components that emit events when actions occur
**Examples**:
* Tool execution requests
* Automation processes
* User interactions
* System status changes
Components that listen for and process specific events
**Examples**:
* Automation workflows
* Activity monitors
* Logging systems
* Analytics processors
The central message broker that routes events
**Responsibilities**:
* Reliable message delivery
* Event persistence
* Publisher/subscriber coordination
* Load management
## The Execution Lifecycle
Tool execution follows a well-defined lifecycle that generates events at each stage:
The process begins when an agent decides to use a tool.
**Events generated**:
* `tool.request.initiated`
* `tool.parameter.validation.started`
**Key information**:
* Tool name and parameters
* Request source (conversation ID, user ID)
* Timestamp and request ID
* Context information
The system validates that all required parameters are present and properly formatted.
**Events generated**:
* `tool.parameter.validation.completed`
* `tool.parameter.validation.failed` (if issues occur)
**Key information**:
* Validation status
* Error details (if any)
* Parameter transformations
* Schema conformance
The actual tool code runs, performing its designated function.
**Events generated**:
* `tool.execution.started`
* `tool.execution.step.completed` (for multi-step tools)
* `tool.execution.completed`
**Key information**:
* Execution duration
* Resource utilization
* Intermediate state
* External system interactions
The system processes the tool's output for agent consumption.
**Events generated**:
* `tool.result.processing.started`
* `tool.result.processing.completed`
**Key information**:
* Raw output data
* Processed results
* Formatting operations
* Output size and structure
The formatted results are returned to the agent.
**Events generated**:
* `tool.response.delivery.started`
* `tool.response.delivery.completed`
**Key information**:
* Final response format
* Delivery time
* End-to-end latency
* Response size
## Accessing Activity in Prisme.ai
You can monitor and analyze tool execution through several interfaces:
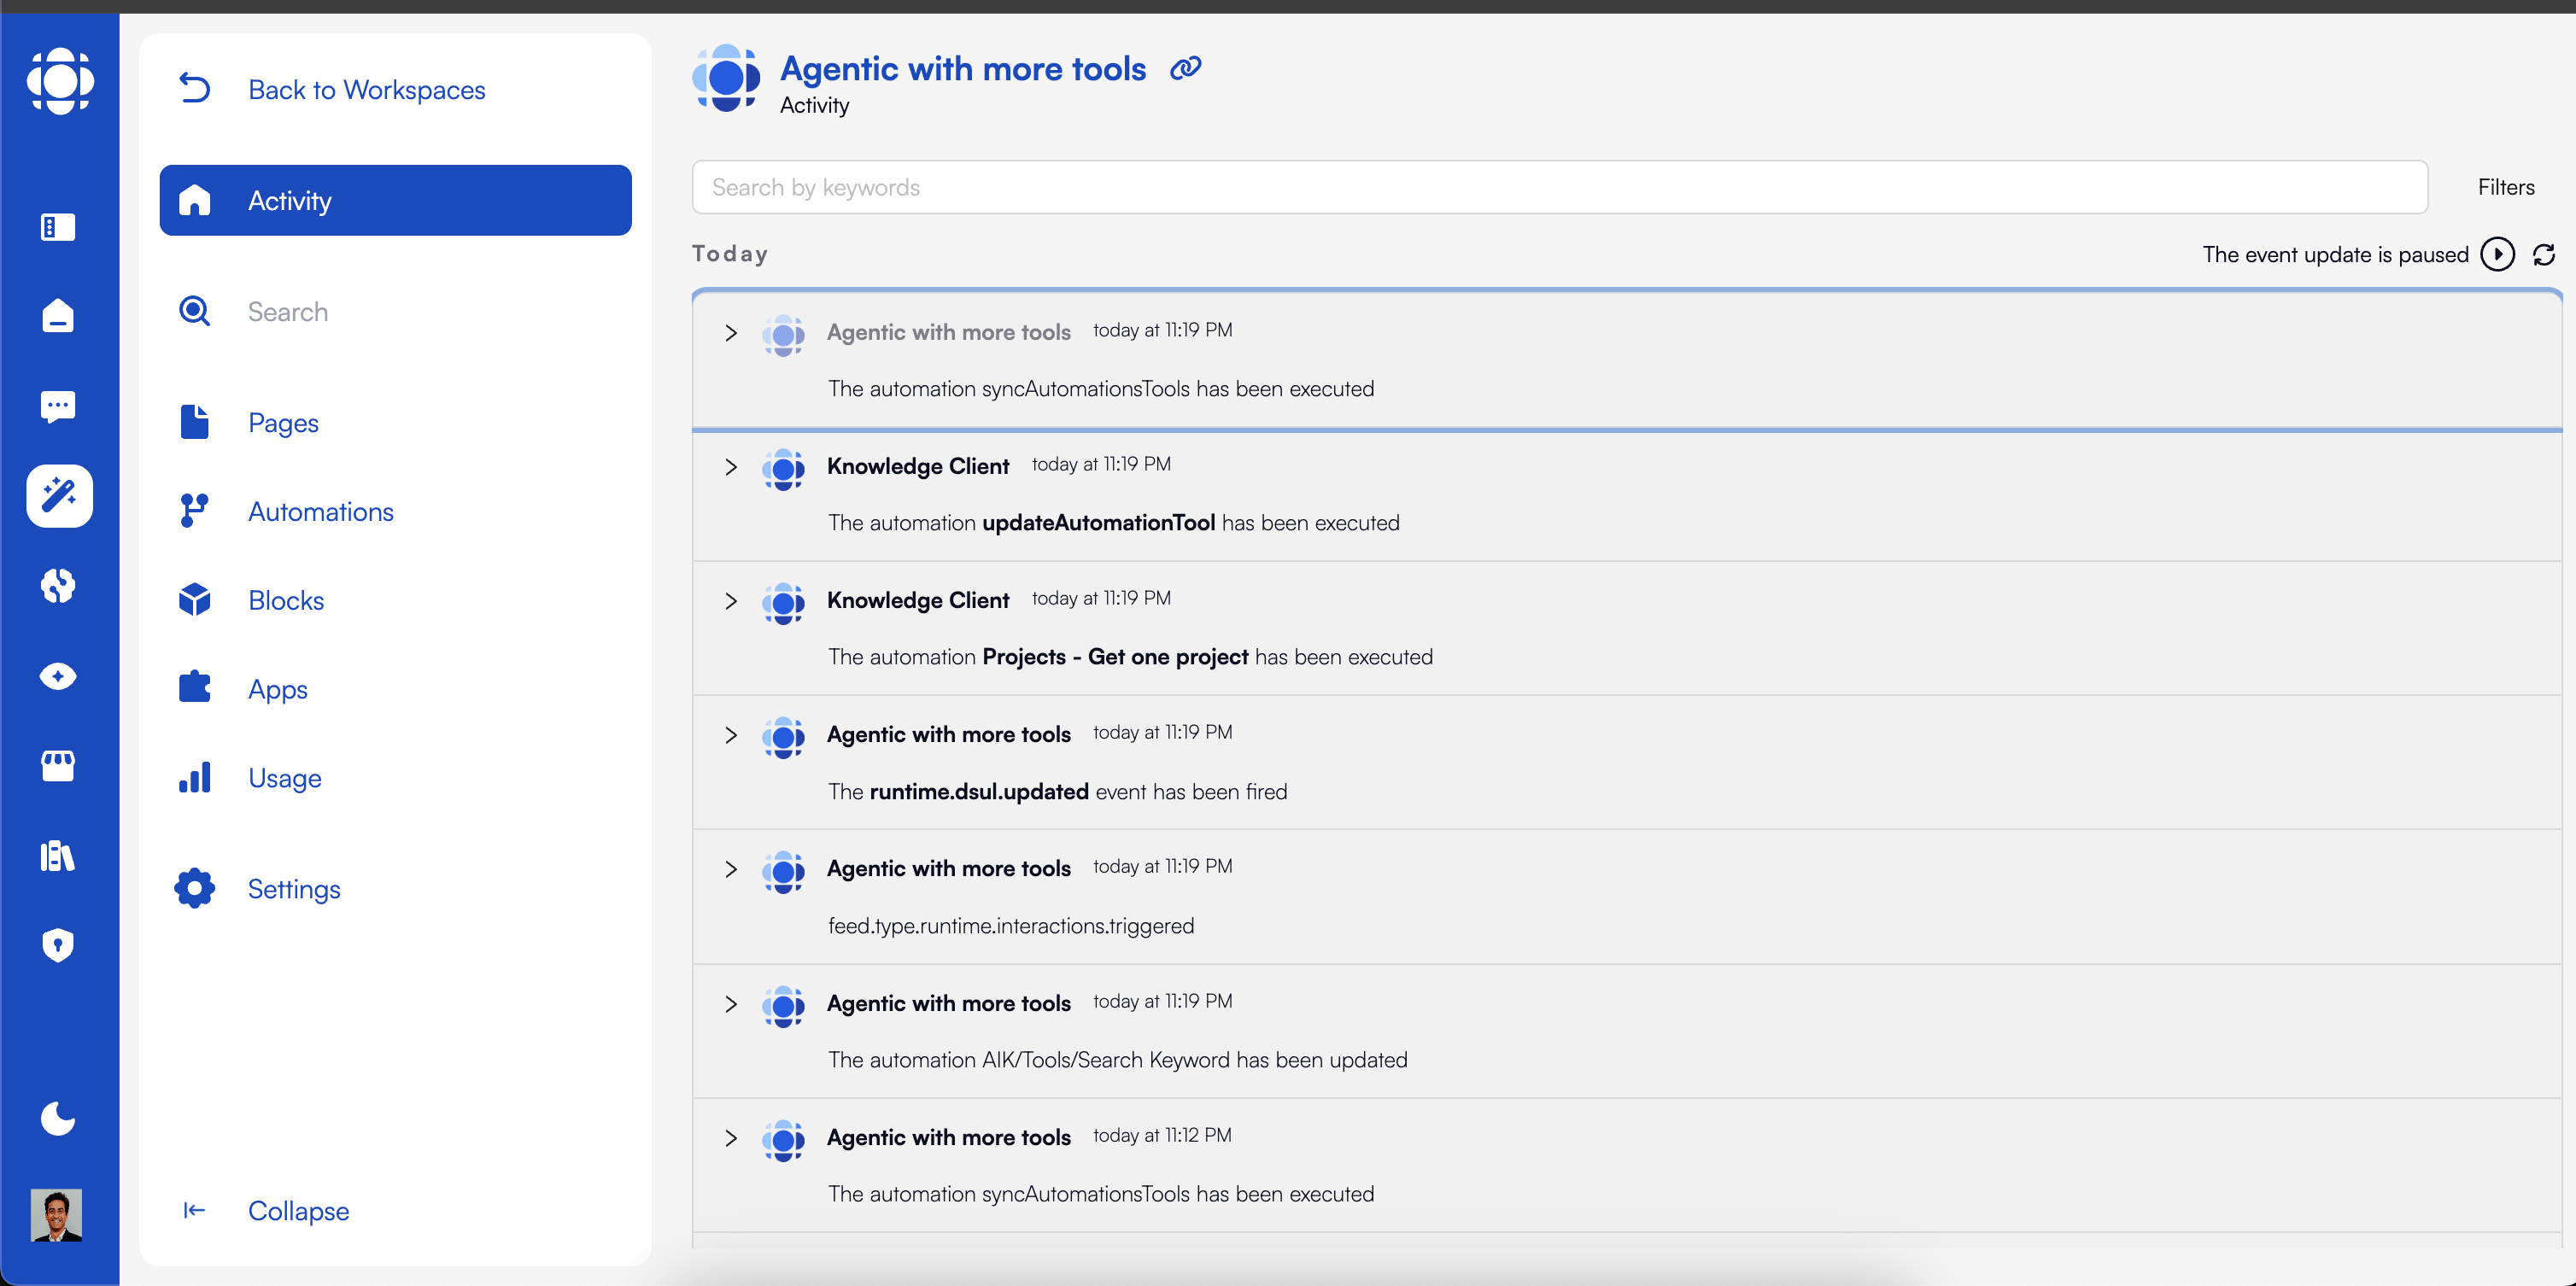
The primary interface for monitoring and debugging tool execution.
**Key features**:
* Chronological event listing
* Filtering by event type, status, or date range
* Detailed event inspection
* Real-time monitoring
* Search capabilities
**Access**:
* Navigate to the "Activity" tab in your AI Builder workspace
* Use filtering to focus on relevant events
* Click on events to see detailed information
* Toggle real-time updates for live monitoring
 Programmatic access to event data for custom monitoring and analysis.
**Key capabilities**:
* Query historical events
* Filter by type, source, or timestamp
* Subscribe to real-time event streams
* Integrate with external monitoring tools
**Example usage**:
```javascript theme={null}
// Fetch recent events from a specific workspace
const options = {
method: 'GET',
headers: {
'X-Prismeai-API-Key': ''
}
};
fetch('https://api.eda.prisme.ai/v2/workspaces/{workspaceId}/events', options)
.then(response => response.json())
.then(response => {
console.log('Event data:', response);
// Process event data
})
.catch(err => console.error('Error fetching events:', err));
```
All activity is stored in your own OpenSearch/Elasticsearch. Build dashboards for performance monitoring and trend analysis.
**Key metrics**:
* Tool usage frequency
* Execution latency
* Error rates
* Resource utilization
* Success/failure trends
**Features**:
* Customizable dashboards
* Real-time updates
* Historical comparisons
* Threshold alerting
* Export capabilities
## Common Event Types
Prisme.ai's event system uses a hierarchical naming convention for clarity and filtering:
Events related to the initial tool request and setup.
**Key event types**:
* `tool.request.initiated`: Initial request for tool execution
* `tool.request.validated`: Request passed preliminary validation
* `tool.request.rejected`: Request failed preliminary checks
**Example event data**:
```json theme={null}
{
"type": "tool.request.initiated",
"timestamp": "2025-03-15T14:32:56.789Z",
"source": "workspace:finance-assistant",
"data": {
"toolName": "StockPriceChecker",
"requestId": "req-123456",
"parameters": {
"symbol": "AAPL",
"dateRange": "5d"
},
"requester": {
"conversationId": "conv-789012",
"userId": "user-345678"
}
}
}
```
Events related to the actual tool execution process.
**Key event types**:
* `tool.execution.started`: Tool execution has begun
* `tool.execution.step.completed`: A step in multi-step execution completed
* `tool.execution.completed`: Tool execution finished successfully
* `tool.execution.failed`: Tool execution encountered an error
**Example event data**:
```json theme={null}
{
"type": "tool.execution.completed",
"timestamp": "2025-03-15T14:33:01.456Z",
"source": "workspace:finance-assistant",
"data": {
"toolName": "StockPriceChecker",
"requestId": "req-123456",
"duration": 4667,
"resourceUsage": {
"cpuTime": 1250,
"memoryPeak": 256384
},
"externalCalls": [
{
"service": "finance-api",
"endpoint": "/stock/price",
"duration": 3890
}
]
}
}
```
Events related to the processing and delivery of tool results.
**Key event types**:
* `tool.result.generated`: Raw results from tool execution
* `tool.result.processed`: Results after formatting and preparation
* `tool.result.delivered`: Final delivery to the requester
**Example event data**:
```json theme={null}
{
"type": "tool.result.processed",
"timestamp": "2025-03-15T14:33:02.123Z",
"source": "workspace:finance-assistant",
"data": {
"toolName": "StockPriceChecker",
"requestId": "req-123456",
"rawResultSize": 8712,
"processedResultSize": 2340,
"resultSummary": {
"symbol": "AAPL",
"currentPrice": 187.43,
"priceChange": 2.31,
"percentChange": 1.25,
"dataPoints": 5
}
}
}
```
Events related to errors during the tool execution lifecycle.
**Key event types**:
* `tool.error.validation`: Error during parameter validation
* `tool.error.execution`: Error during tool execution
* `tool.error.timeout`: Execution exceeded allocated time
* `tool.error.resource`: Resource limit exceeded
**Example event data**:
```json theme={null}
{
"type": "tool.error.execution",
"timestamp": "2025-03-15T14:33:00.789Z",
"source": "workspace:finance-assistant",
"data": {
"toolName": "StockPriceChecker",
"requestId": "req-123456",
"errorCode": "API_UNAVAILABLE",
"errorMessage": "External finance API returned status 503",
"errorDetails": {
"httpStatus": 503,
"responseBody": "Service temporarily unavailable",
"endpoint": "https://finance-api.example.com/stock/price"
},
"executionStage": "external_api_call"
}
}
```
## Debugging with Activity
Activity tracking provides powerful capabilities for diagnosing and resolving issues:
Use filtering to locate relevant events.
Effective filtering strategies:
* Search for specific request IDs
* Filter by error event types
* Focus on a specific time range
* Filter by tool name or source
* Search for specific error codes
Follow the sequence of events to understand the execution path.
Key analysis techniques:
* Map the complete event sequence
* Identify missing or unexpected events
* Analyze timing between events
* Examine state changes across events
* Look for execution branches
Inspect detailed event data for diagnostic information.
Focus areas:
* Parameter values and transformations
* Error details and context
* Performance metrics
* External system interactions
* Resource utilization
Analyze differences between failed and successful runs.
Comparison strategies:
* Identify parameter differences
* Compare timing patterns
* Analyze resource usage
* Examine external factors
* Look for environmental changes
Make changes and confirm resolution through activity monitoring.
Verification approach:
* Test the same parameters
* Monitor in real-time
* Verify complete event sequence
* Check performance metrics
* Test edge cases
## Monitoring Performance with Activity
Activity data is invaluable for performance optimization:
Identify and address performance bottlenecks.
**Key metrics to monitor**:
* **End-to-end latency**: Total time from request to response
* **Execution time**: Time spent in actual tool execution
* **External call latency**: Time spent waiting for external services
* **Processing overhead**: Time spent in non-execution activities
**Implementation approach**:
```javascript theme={null}
// Calculate average latencies by tool
function analyzeToolLatencies(events, timeRange) {
const executions = {};
// Group events by request ID
events.forEach(event => {
if (!executions[event.data.requestId]) {
executions[event.data.requestId] = {
tool: event.data.toolName,
events: []
};
}
executions[event.data.requestId].events.push(event);
});
// Calculate metrics for each execution
const toolMetrics = {};
Object.values(executions).forEach(execution => {
const startEvent = execution.events.find(e => e.type === 'tool.request.initiated');
const endEvent = execution.events.find(e => e.type === 'tool.result.delivered');
const execStartEvent = execution.events.find(e => e.type === 'tool.execution.started');
const execEndEvent = execution.events.find(e => e.type === 'tool.execution.completed');
if (startEvent && endEvent && execStartEvent && execEndEvent) {
const tool = execution.tool;
if (!toolMetrics[tool]) {
toolMetrics[tool] = {
count: 0,
totalLatency: 0,
totalExecTime: 0,
totalOverhead: 0
};
}
const latency = endEvent.timestamp - startEvent.timestamp;
const execTime = execEndEvent.timestamp - execStartEvent.timestamp;
const overhead = latency - execTime;
toolMetrics[tool].count++;
toolMetrics[tool].totalLatency += latency;
toolMetrics[tool].totalExecTime += execTime;
toolMetrics[tool].totalOverhead += overhead;
}
});
// Calculate averages
Object.keys(toolMetrics).forEach(tool => {
const metrics = toolMetrics[tool];
metrics.avgLatency = metrics.totalLatency / metrics.count;
metrics.avgExecTime = metrics.totalExecTime / metrics.count;
metrics.avgOverhead = metrics.totalOverhead / metrics.count;
metrics.overheadPercentage = (metrics.avgOverhead / metrics.avgLatency) * 100;
});
return toolMetrics;
}
```
Monitor and minimize tool failures.
**Key metrics to track**:
* **Overall error rate**: Percentage of tool executions that fail
* **Error breakdown by type**: Distribution of different error categories
* **Error trends**: Changes in error rates over time
* **Correlation analysis**: Factors associated with higher error rates
**Implementation approach**:
```javascript theme={null}
// Calculate error rates by tool and type
function analyzeErrorRates(events, timeRange) {
const toolStats = {};
// Count total executions and errors
events.forEach(event => {
const tool = event.data.toolName;
if (!toolStats[tool]) {
toolStats[tool] = {
totalExecutions: 0,
errors: {
total: 0,
byType: {}
}
};
}
if (event.type === 'tool.execution.started') {
toolStats[tool].totalExecutions++;
}
if (event.type.startsWith('tool.error.')) {
toolStats[tool].errors.total++;
const errorType = event.type.replace('tool.error.', '');
if (!toolStats[tool].errors.byType[errorType]) {
toolStats[tool].errors.byType[errorType] = 0;
}
toolStats[tool].errors.byType[errorType]++;
}
});
// Calculate rates
Object.keys(toolStats).forEach(tool => {
const stats = toolStats[tool];
stats.errorRate = stats.errors.total / stats.totalExecutions;
stats.errors.typeBreakdown = {};
Object.keys(stats.errors.byType).forEach(errorType => {
stats.errors.typeBreakdown[errorType] =
stats.errors.byType[errorType] / stats.errors.total;
});
});
return toolStats;
}
```
Understand how tools are being used.
**Key metrics to analyze**:
* **Usage frequency**: How often each tool is called
* **Parameter distributions**: Common values and patterns
* **Usage contexts**: When and why tools are invoked
* **User segmentation**: Differences in tool usage across users
**Implementation approach**:
```javascript theme={null}
// Analyze tool usage patterns
function analyzeUsagePatterns(events, timeRange) {
const usageStats = {
byTool: {},
byHour: Array(24).fill(0),
byUser: {},
parameterDistributions: {}
};
events.forEach(event => {
if (event.type === 'tool.request.initiated') {
const tool = event.data.toolName;
const timestamp = new Date(event.timestamp);
const hour = timestamp.getHours();
const userId = event.data.requester?.userId || 'unknown';
const parameters = event.data.parameters || {};
// Count by tool
if (!usageStats.byTool[tool]) {
usageStats.byTool[tool] = 0;
}
usageStats.byTool[tool]++;
// Count by hour
usageStats.byHour[hour]++;
// Count by user
if (!usageStats.byUser[userId]) {
usageStats.byUser[userId] = {
total: 0,
byTool: {}
};
}
usageStats.byUser[userId].total++;
if (!usageStats.byUser[userId].byTool[tool]) {
usageStats.byUser[userId].byTool[tool] = 0;
}
usageStats.byUser[userId].byTool[tool]++;
// Analyze parameters
if (!usageStats.parameterDistributions[tool]) {
usageStats.parameterDistributions[tool] = {};
}
Object.keys(parameters).forEach(param => {
if (!usageStats.parameterDistributions[tool][param]) {
usageStats.parameterDistributions[tool][param] = {};
}
const value = String(parameters[param]);
if (!usageStats.parameterDistributions[tool][param][value]) {
usageStats.parameterDistributions[tool][param][value] = 0;
}
usageStats.parameterDistributions[tool][param][value]++;
});
}
});
return usageStats;
}
```
## Optimizing Tool Execution
Use Activity data to drive execution optimizations:
Refine parameter handling based on usage patterns
**Strategies**:
* Add intelligent defaults for common values
* Implement parameter validation improvements
* Optimize parameter extraction from user inputs
* Add preprocessing for frequently used parameter formats
Improve tool execution performance
**Strategies**:
* Identify and optimize slow execution steps
* Implement caching for frequent operations
* Reduce external API latency
* Optimize resource utilization
Minimize tool execution failures
**Strategies**:
* Add robust error handling for common failures
* Implement automatic retries for transient issues
* Improve validation to catch problems early
* Create fallback mechanisms for critical functions
Enhance result formatting and delivery
**Strategies**:
* Optimize result formatting for LLM consumption
* Reduce result size for better context utilization
* Implement progressive result delivery for long operations
* Add enrichment for more valuable outputs
## Custom Event Emission
You can emit custom events to enhance visibility into your tools:
Define your own event types for specialized monitoring.
**Naming conventions**:
```
custom.[workspace].[category].[action]
```
**Examples**:
* `custom.finance-assistant.calculation.started`
* `custom.support-agent.ticket.created`
* `custom.inventory-tool.stock.checked`
This allows for clear organization and filtering of your custom events.
Add custom event emission to your tools.
**Example implementation**:
```yaml theme={null}
slug: product-recommendation-tool
do:
# Emit custom event to track recommendation request
- emit:
event: custom.product-tool.recommendation.requested
data:
userId: '{{event.data.userId}}'
productCategory: '{{event.data.parameters.category}}'
priceRange: '{{event.data.parameters.priceRange}}'
timestamp: '{{now()}}'
# Execute recommendation logic
- ProductCatalog.search:
category: '{{event.data.parameters.category}}'
priceMin: '{{event.data.parameters.priceRange.min}}'
priceMax: '{{event.data.parameters.priceRange.max}}'
output: searchResults
# Emit event for search completion
- emit:
event: custom.product-tool.search.completed
data:
resultsCount: '{{length(searchResults.products)}}'
executionTime: '{{searchResults.executionTime}}'
# Apply recommendation algorithm
- RecommendationEngine.process:
products: '{{searchResults.products}}'
userPreferences: '{{event.data.parameters.preferences}}'
output: recommendations
# Emit final recommendation event
- emit:
event: custom.product-tool.recommendation.generated
data:
recommendationCount: '{{length(recommendations)}}'
topRecommendationId: '{{recommendations[0].id}}'
algorithmsApplied: '{{recommendations.algorithmsApplied}}'
# Return results
- set:
name: output
value:
recommendations: '{{recommendations}}'
```
This approach:
* Provides detailed visibility into tool execution stages
* Captures business-specific metrics
* Enables more nuanced performance analysis
* Creates richer debugging context
Design effective event payloads for maximum utility.
**Recommendations**:
* **Include identifiers**: Always add request IDs, user IDs, and other correlation identifiers
* **Add timestamps**: Include timing information for performance analysis
* **Provide context**: Add relevant business context to make events meaningful
* **Size appropriately**: Include useful data without making events too large
* **Structure consistently**: Use consistent naming and structure across related events
**Example event structure**:
```json theme={null}
{
"type": "custom.order-tool.validation.completed",
"timestamp": "2025-03-15T15:45:12.678Z",
"source": "workspace:commerce-assistant",
"data": {
"requestId": "req-abc123",
"orderId": "ORD-98765",
"validationResults": {
"inventory": {
"status": "passed",
"duration": 124
},
"pricing": {
"status": "passed",
"duration": 86
},
"shipping": {
"status": "warning",
"message": "Delivery may be delayed",
"duration": 231
}
},
"totalDuration": 441,
"validationPassed": true
}
}
```
## Real-Time Monitoring
For critical tools, implement real-time monitoring using Activity:
Create specialized dashboards for key metrics.
Include dashboards for:
* Error rates and types
* Execution latency
* Usage volume
* Resource utilization
* Business-specific metrics
Define thresholds and conditions for notifications.
Alert types to consider:
* Error rate spikes
* Latency threshold violations
* Abnormal usage patterns
* Resource exhaustion warnings
* Custom business metric anomalies
Create subscribers for real-time processing.
Example implementation:
```yaml theme={null}
slug: error-rate-monitor
when:
event: tool.error.*
do:
# Increment error counter
- cache.increment:
key: 'error:{{date(now(), "YYYY-MM-DD:HH")}}'
value: 1
expire: 86400 # 24 hours
# Get current hour's execution count
- cache.get:
key: 'executions:{{date(now(), "YYYY-MM-DD:HH")}}'
output: executionCount
# Get current hour's error count
- cache.get:
key: 'error:{{date(now(), "YYYY-MM-DD:HH")}}'
output: errorCount
# Calculate error rate
- set:
name: errorRate
value: '{{errorCount / executionCount}}'
# Check if threshold exceeded
- conditions:
'{{errorRate > 0.05 && executionCount > 10}}': # 5% error rate with at least 10 executions
- notification.send:
channel: 'slack'
message: 'Alert: Tool error rate at {{errorRate * 100}}% ({{errorCount}} errors out of {{executionCount}} executions) in the past hour'
```
Track overall system performance and health.
Focus areas:
* API response times
* Service availability
* Resource utilization
* Queue lengths
* Error distributions
## Activity for Compliance and Audit
Beyond operational uses, Activity provides essential compliance capabilities:
Maintain comprehensive records of all tool interactions
**Key aspects**:
* Complete chronological record of events
* User and system actions
* Parameter and result tracking
* Timing information
* Access evidence
Generate reports for regulatory requirements
**Capabilities**:
* Data access audit reports
* Processing evidence
* Security monitoring
* Policy enforcement verification
* Chain of custody documentation
Detailed investigation of specific incidents
**Use cases**:
* Security incident investigation
* Error root cause analysis
* User behavior auditing
* System interaction reconstruction
* Performance issue diagnostics
Maintain activity data according to policies
**Considerations**:
* Retention period configuration
* Data archiving strategies
* Privacy compliance
* Data minimization
* Access controls
## Best Practices for Activity Utilization
Plan your event ecosystem for maximum value.
**Recommendations**:
* **Define an event taxonomy**: Create a consistent naming and categorization system
* **Identify key lifecycle events**: Ensure all important state transitions emit events
* **Balance detail and volume**: Emit enough events for visibility without overwhelming storage
* **Consider event consumers**: Design with reporting, monitoring, and analysis needs in mind
* **Document event types**: Maintain clear documentation of all events and their meanings
**Implementation approach**:
```
Event Naming Structure:
[domain].[entity].[action]
Examples:
- tool.request.initiated
- order.payment.processed
- user.profile.updated
- system.resource.allocated
```
Create filtering strategies for efficient data access.
**Recommendations**:
* **Use consistent metadata**: Add standard fields like request IDs to enable correlation
* **Include categorization data**: Add tags, types, and categories for efficient filtering
* **Consider time-based access**: Optimize for common time-range queries
* **Balance filter granularity**: Too granular filters can be as problematic as too broad ones
* **Test filter performance**: Ensure filtering is efficient at production scale
**Example filtering approach**:
```javascript theme={null}
// Effective event filtering
const events = await activity.queryEvents({
// Time range
timeRange: {
start: new Date(Date.now() - (7 * 24 * 60 * 60 * 1000)), // 7 days ago
end: new Date()
},
// Event types (using hierarchical pattern)
eventTypes: ['tool.execution.*', 'tool.error.*'],
// Source filter
sources: ['workspace:customer-service'],
// Metadata filters
filters: [
{ field: 'data.requestId', operator: 'eq', value: 'req-123456' },
{ field: 'data.toolName', operator: 'in', value: ['CustomerLookup', 'OrderStatus'] }
],
// Sorting
sort: { field: 'timestamp', direction: 'desc' },
// Pagination
limit: 100,
offset: 0
});
```
Ensure your activity management scales with usage.
**Recommendations**:
* **Implement data lifecycle management**: Archive older events to control storage growth
* **Consider sampling for high-volume events**: For very frequent events, consider sampling
* **Optimize query patterns**: Design queries to use available indexes
* **Leverage aggregation**: Use pre-aggregated metrics for frequent analyses
* **Plan for growth**: Design with future scale in mind
**Example lifecycle implementation**:
```yaml theme={null}
slug: activity-lifecycle-management
when:
schedule: '0 0 * * *' # Daily at midnight
do:
# Archive events older than 30 days
- activity.archiveEvents:
olderThan: '{{date.add(now(), -30, "days")}}'
destination: 'cold-storage'
# Delete archived events older than 365 days
- activity.deleteArchivedEvents:
olderThan: '{{date.add(now(), -365, "days")}}'
# Aggregate metrics for retention
- activity.aggregateMetrics:
timeRange:
start: '{{date.add(now(), -2, "days")}}'
end: '{{date.add(now(), -1, "days")}}'
dimensions: ['toolName', 'hour', 'errorType']
metrics: ['count', 'avgDuration', 'errorRate']
# Emit completion event
- emit:
event: system.activity.lifecycle.completed
data:
timestamp: '{{now()}}'
```
## Activity in AI Knowledge
For AI Knowledge users, Activity information is accessible through built-in interfaces:
Find the Activity section in AI Knowledge.
Key features:
* Chronological event listing
* Filtering by event type and date
* Search capabilities
* Drill-down for details
Track how agents are using tools.
Available information:
* Tool usage frequency
* Success and error rates
* Performance metrics
* Parameter patterns
Examine how tools integrate into conversations.
Analysis capabilities:
* Tool usage in conversation context
* User reactions to tool results
* Multi-turn tool interactions
* Conversation paths and patterns
Extract data for external analysis.
Export options:
* CSV for spreadsheet analysis
* JSON for programmatic processing
* Filtered or complete data sets
* Custom date ranges
## Next Steps
Ready to implement effective execution monitoring and activity tracking? Continue with these resources:
Learn how to implement robust error management
Explore the event system in greater depth
Programmatic access to event data for custom monitoring and analysis.
**Key capabilities**:
* Query historical events
* Filter by type, source, or timestamp
* Subscribe to real-time event streams
* Integrate with external monitoring tools
**Example usage**:
```javascript theme={null}
// Fetch recent events from a specific workspace
const options = {
method: 'GET',
headers: {
'X-Prismeai-API-Key': ''
}
};
fetch('https://api.eda.prisme.ai/v2/workspaces/{workspaceId}/events', options)
.then(response => response.json())
.then(response => {
console.log('Event data:', response);
// Process event data
})
.catch(err => console.error('Error fetching events:', err));
```
All activity is stored in your own OpenSearch/Elasticsearch. Build dashboards for performance monitoring and trend analysis.
**Key metrics**:
* Tool usage frequency
* Execution latency
* Error rates
* Resource utilization
* Success/failure trends
**Features**:
* Customizable dashboards
* Real-time updates
* Historical comparisons
* Threshold alerting
* Export capabilities
## Common Event Types
Prisme.ai's event system uses a hierarchical naming convention for clarity and filtering:
Events related to the initial tool request and setup.
**Key event types**:
* `tool.request.initiated`: Initial request for tool execution
* `tool.request.validated`: Request passed preliminary validation
* `tool.request.rejected`: Request failed preliminary checks
**Example event data**:
```json theme={null}
{
"type": "tool.request.initiated",
"timestamp": "2025-03-15T14:32:56.789Z",
"source": "workspace:finance-assistant",
"data": {
"toolName": "StockPriceChecker",
"requestId": "req-123456",
"parameters": {
"symbol": "AAPL",
"dateRange": "5d"
},
"requester": {
"conversationId": "conv-789012",
"userId": "user-345678"
}
}
}
```
Events related to the actual tool execution process.
**Key event types**:
* `tool.execution.started`: Tool execution has begun
* `tool.execution.step.completed`: A step in multi-step execution completed
* `tool.execution.completed`: Tool execution finished successfully
* `tool.execution.failed`: Tool execution encountered an error
**Example event data**:
```json theme={null}
{
"type": "tool.execution.completed",
"timestamp": "2025-03-15T14:33:01.456Z",
"source": "workspace:finance-assistant",
"data": {
"toolName": "StockPriceChecker",
"requestId": "req-123456",
"duration": 4667,
"resourceUsage": {
"cpuTime": 1250,
"memoryPeak": 256384
},
"externalCalls": [
{
"service": "finance-api",
"endpoint": "/stock/price",
"duration": 3890
}
]
}
}
```
Events related to the processing and delivery of tool results.
**Key event types**:
* `tool.result.generated`: Raw results from tool execution
* `tool.result.processed`: Results after formatting and preparation
* `tool.result.delivered`: Final delivery to the requester
**Example event data**:
```json theme={null}
{
"type": "tool.result.processed",
"timestamp": "2025-03-15T14:33:02.123Z",
"source": "workspace:finance-assistant",
"data": {
"toolName": "StockPriceChecker",
"requestId": "req-123456",
"rawResultSize": 8712,
"processedResultSize": 2340,
"resultSummary": {
"symbol": "AAPL",
"currentPrice": 187.43,
"priceChange": 2.31,
"percentChange": 1.25,
"dataPoints": 5
}
}
}
```
Events related to errors during the tool execution lifecycle.
**Key event types**:
* `tool.error.validation`: Error during parameter validation
* `tool.error.execution`: Error during tool execution
* `tool.error.timeout`: Execution exceeded allocated time
* `tool.error.resource`: Resource limit exceeded
**Example event data**:
```json theme={null}
{
"type": "tool.error.execution",
"timestamp": "2025-03-15T14:33:00.789Z",
"source": "workspace:finance-assistant",
"data": {
"toolName": "StockPriceChecker",
"requestId": "req-123456",
"errorCode": "API_UNAVAILABLE",
"errorMessage": "External finance API returned status 503",
"errorDetails": {
"httpStatus": 503,
"responseBody": "Service temporarily unavailable",
"endpoint": "https://finance-api.example.com/stock/price"
},
"executionStage": "external_api_call"
}
}
```
## Debugging with Activity
Activity tracking provides powerful capabilities for diagnosing and resolving issues:
Use filtering to locate relevant events.
Effective filtering strategies:
* Search for specific request IDs
* Filter by error event types
* Focus on a specific time range
* Filter by tool name or source
* Search for specific error codes
Follow the sequence of events to understand the execution path.
Key analysis techniques:
* Map the complete event sequence
* Identify missing or unexpected events
* Analyze timing between events
* Examine state changes across events
* Look for execution branches
Inspect detailed event data for diagnostic information.
Focus areas:
* Parameter values and transformations
* Error details and context
* Performance metrics
* External system interactions
* Resource utilization
Analyze differences between failed and successful runs.
Comparison strategies:
* Identify parameter differences
* Compare timing patterns
* Analyze resource usage
* Examine external factors
* Look for environmental changes
Make changes and confirm resolution through activity monitoring.
Verification approach:
* Test the same parameters
* Monitor in real-time
* Verify complete event sequence
* Check performance metrics
* Test edge cases
## Monitoring Performance with Activity
Activity data is invaluable for performance optimization:
Identify and address performance bottlenecks.
**Key metrics to monitor**:
* **End-to-end latency**: Total time from request to response
* **Execution time**: Time spent in actual tool execution
* **External call latency**: Time spent waiting for external services
* **Processing overhead**: Time spent in non-execution activities
**Implementation approach**:
```javascript theme={null}
// Calculate average latencies by tool
function analyzeToolLatencies(events, timeRange) {
const executions = {};
// Group events by request ID
events.forEach(event => {
if (!executions[event.data.requestId]) {
executions[event.data.requestId] = {
tool: event.data.toolName,
events: []
};
}
executions[event.data.requestId].events.push(event);
});
// Calculate metrics for each execution
const toolMetrics = {};
Object.values(executions).forEach(execution => {
const startEvent = execution.events.find(e => e.type === 'tool.request.initiated');
const endEvent = execution.events.find(e => e.type === 'tool.result.delivered');
const execStartEvent = execution.events.find(e => e.type === 'tool.execution.started');
const execEndEvent = execution.events.find(e => e.type === 'tool.execution.completed');
if (startEvent && endEvent && execStartEvent && execEndEvent) {
const tool = execution.tool;
if (!toolMetrics[tool]) {
toolMetrics[tool] = {
count: 0,
totalLatency: 0,
totalExecTime: 0,
totalOverhead: 0
};
}
const latency = endEvent.timestamp - startEvent.timestamp;
const execTime = execEndEvent.timestamp - execStartEvent.timestamp;
const overhead = latency - execTime;
toolMetrics[tool].count++;
toolMetrics[tool].totalLatency += latency;
toolMetrics[tool].totalExecTime += execTime;
toolMetrics[tool].totalOverhead += overhead;
}
});
// Calculate averages
Object.keys(toolMetrics).forEach(tool => {
const metrics = toolMetrics[tool];
metrics.avgLatency = metrics.totalLatency / metrics.count;
metrics.avgExecTime = metrics.totalExecTime / metrics.count;
metrics.avgOverhead = metrics.totalOverhead / metrics.count;
metrics.overheadPercentage = (metrics.avgOverhead / metrics.avgLatency) * 100;
});
return toolMetrics;
}
```
Monitor and minimize tool failures.
**Key metrics to track**:
* **Overall error rate**: Percentage of tool executions that fail
* **Error breakdown by type**: Distribution of different error categories
* **Error trends**: Changes in error rates over time
* **Correlation analysis**: Factors associated with higher error rates
**Implementation approach**:
```javascript theme={null}
// Calculate error rates by tool and type
function analyzeErrorRates(events, timeRange) {
const toolStats = {};
// Count total executions and errors
events.forEach(event => {
const tool = event.data.toolName;
if (!toolStats[tool]) {
toolStats[tool] = {
totalExecutions: 0,
errors: {
total: 0,
byType: {}
}
};
}
if (event.type === 'tool.execution.started') {
toolStats[tool].totalExecutions++;
}
if (event.type.startsWith('tool.error.')) {
toolStats[tool].errors.total++;
const errorType = event.type.replace('tool.error.', '');
if (!toolStats[tool].errors.byType[errorType]) {
toolStats[tool].errors.byType[errorType] = 0;
}
toolStats[tool].errors.byType[errorType]++;
}
});
// Calculate rates
Object.keys(toolStats).forEach(tool => {
const stats = toolStats[tool];
stats.errorRate = stats.errors.total / stats.totalExecutions;
stats.errors.typeBreakdown = {};
Object.keys(stats.errors.byType).forEach(errorType => {
stats.errors.typeBreakdown[errorType] =
stats.errors.byType[errorType] / stats.errors.total;
});
});
return toolStats;
}
```
Understand how tools are being used.
**Key metrics to analyze**:
* **Usage frequency**: How often each tool is called
* **Parameter distributions**: Common values and patterns
* **Usage contexts**: When and why tools are invoked
* **User segmentation**: Differences in tool usage across users
**Implementation approach**:
```javascript theme={null}
// Analyze tool usage patterns
function analyzeUsagePatterns(events, timeRange) {
const usageStats = {
byTool: {},
byHour: Array(24).fill(0),
byUser: {},
parameterDistributions: {}
};
events.forEach(event => {
if (event.type === 'tool.request.initiated') {
const tool = event.data.toolName;
const timestamp = new Date(event.timestamp);
const hour = timestamp.getHours();
const userId = event.data.requester?.userId || 'unknown';
const parameters = event.data.parameters || {};
// Count by tool
if (!usageStats.byTool[tool]) {
usageStats.byTool[tool] = 0;
}
usageStats.byTool[tool]++;
// Count by hour
usageStats.byHour[hour]++;
// Count by user
if (!usageStats.byUser[userId]) {
usageStats.byUser[userId] = {
total: 0,
byTool: {}
};
}
usageStats.byUser[userId].total++;
if (!usageStats.byUser[userId].byTool[tool]) {
usageStats.byUser[userId].byTool[tool] = 0;
}
usageStats.byUser[userId].byTool[tool]++;
// Analyze parameters
if (!usageStats.parameterDistributions[tool]) {
usageStats.parameterDistributions[tool] = {};
}
Object.keys(parameters).forEach(param => {
if (!usageStats.parameterDistributions[tool][param]) {
usageStats.parameterDistributions[tool][param] = {};
}
const value = String(parameters[param]);
if (!usageStats.parameterDistributions[tool][param][value]) {
usageStats.parameterDistributions[tool][param][value] = 0;
}
usageStats.parameterDistributions[tool][param][value]++;
});
}
});
return usageStats;
}
```
## Optimizing Tool Execution
Use Activity data to drive execution optimizations:
Refine parameter handling based on usage patterns
**Strategies**:
* Add intelligent defaults for common values
* Implement parameter validation improvements
* Optimize parameter extraction from user inputs
* Add preprocessing for frequently used parameter formats
Improve tool execution performance
**Strategies**:
* Identify and optimize slow execution steps
* Implement caching for frequent operations
* Reduce external API latency
* Optimize resource utilization
Minimize tool execution failures
**Strategies**:
* Add robust error handling for common failures
* Implement automatic retries for transient issues
* Improve validation to catch problems early
* Create fallback mechanisms for critical functions
Enhance result formatting and delivery
**Strategies**:
* Optimize result formatting for LLM consumption
* Reduce result size for better context utilization
* Implement progressive result delivery for long operations
* Add enrichment for more valuable outputs
## Custom Event Emission
You can emit custom events to enhance visibility into your tools:
Define your own event types for specialized monitoring.
**Naming conventions**:
```
custom.[workspace].[category].[action]
```
**Examples**:
* `custom.finance-assistant.calculation.started`
* `custom.support-agent.ticket.created`
* `custom.inventory-tool.stock.checked`
This allows for clear organization and filtering of your custom events.
Add custom event emission to your tools.
**Example implementation**:
```yaml theme={null}
slug: product-recommendation-tool
do:
# Emit custom event to track recommendation request
- emit:
event: custom.product-tool.recommendation.requested
data:
userId: '{{event.data.userId}}'
productCategory: '{{event.data.parameters.category}}'
priceRange: '{{event.data.parameters.priceRange}}'
timestamp: '{{now()}}'
# Execute recommendation logic
- ProductCatalog.search:
category: '{{event.data.parameters.category}}'
priceMin: '{{event.data.parameters.priceRange.min}}'
priceMax: '{{event.data.parameters.priceRange.max}}'
output: searchResults
# Emit event for search completion
- emit:
event: custom.product-tool.search.completed
data:
resultsCount: '{{length(searchResults.products)}}'
executionTime: '{{searchResults.executionTime}}'
# Apply recommendation algorithm
- RecommendationEngine.process:
products: '{{searchResults.products}}'
userPreferences: '{{event.data.parameters.preferences}}'
output: recommendations
# Emit final recommendation event
- emit:
event: custom.product-tool.recommendation.generated
data:
recommendationCount: '{{length(recommendations)}}'
topRecommendationId: '{{recommendations[0].id}}'
algorithmsApplied: '{{recommendations.algorithmsApplied}}'
# Return results
- set:
name: output
value:
recommendations: '{{recommendations}}'
```
This approach:
* Provides detailed visibility into tool execution stages
* Captures business-specific metrics
* Enables more nuanced performance analysis
* Creates richer debugging context
Design effective event payloads for maximum utility.
**Recommendations**:
* **Include identifiers**: Always add request IDs, user IDs, and other correlation identifiers
* **Add timestamps**: Include timing information for performance analysis
* **Provide context**: Add relevant business context to make events meaningful
* **Size appropriately**: Include useful data without making events too large
* **Structure consistently**: Use consistent naming and structure across related events
**Example event structure**:
```json theme={null}
{
"type": "custom.order-tool.validation.completed",
"timestamp": "2025-03-15T15:45:12.678Z",
"source": "workspace:commerce-assistant",
"data": {
"requestId": "req-abc123",
"orderId": "ORD-98765",
"validationResults": {
"inventory": {
"status": "passed",
"duration": 124
},
"pricing": {
"status": "passed",
"duration": 86
},
"shipping": {
"status": "warning",
"message": "Delivery may be delayed",
"duration": 231
}
},
"totalDuration": 441,
"validationPassed": true
}
}
```
## Real-Time Monitoring
For critical tools, implement real-time monitoring using Activity:
Create specialized dashboards for key metrics.
Include dashboards for:
* Error rates and types
* Execution latency
* Usage volume
* Resource utilization
* Business-specific metrics
Define thresholds and conditions for notifications.
Alert types to consider:
* Error rate spikes
* Latency threshold violations
* Abnormal usage patterns
* Resource exhaustion warnings
* Custom business metric anomalies
Create subscribers for real-time processing.
Example implementation:
```yaml theme={null}
slug: error-rate-monitor
when:
event: tool.error.*
do:
# Increment error counter
- cache.increment:
key: 'error:{{date(now(), "YYYY-MM-DD:HH")}}'
value: 1
expire: 86400 # 24 hours
# Get current hour's execution count
- cache.get:
key: 'executions:{{date(now(), "YYYY-MM-DD:HH")}}'
output: executionCount
# Get current hour's error count
- cache.get:
key: 'error:{{date(now(), "YYYY-MM-DD:HH")}}'
output: errorCount
# Calculate error rate
- set:
name: errorRate
value: '{{errorCount / executionCount}}'
# Check if threshold exceeded
- conditions:
'{{errorRate > 0.05 && executionCount > 10}}': # 5% error rate with at least 10 executions
- notification.send:
channel: 'slack'
message: 'Alert: Tool error rate at {{errorRate * 100}}% ({{errorCount}} errors out of {{executionCount}} executions) in the past hour'
```
Track overall system performance and health.
Focus areas:
* API response times
* Service availability
* Resource utilization
* Queue lengths
* Error distributions
## Activity for Compliance and Audit
Beyond operational uses, Activity provides essential compliance capabilities:
Maintain comprehensive records of all tool interactions
**Key aspects**:
* Complete chronological record of events
* User and system actions
* Parameter and result tracking
* Timing information
* Access evidence
Generate reports for regulatory requirements
**Capabilities**:
* Data access audit reports
* Processing evidence
* Security monitoring
* Policy enforcement verification
* Chain of custody documentation
Detailed investigation of specific incidents
**Use cases**:
* Security incident investigation
* Error root cause analysis
* User behavior auditing
* System interaction reconstruction
* Performance issue diagnostics
Maintain activity data according to policies
**Considerations**:
* Retention period configuration
* Data archiving strategies
* Privacy compliance
* Data minimization
* Access controls
## Best Practices for Activity Utilization
Plan your event ecosystem for maximum value.
**Recommendations**:
* **Define an event taxonomy**: Create a consistent naming and categorization system
* **Identify key lifecycle events**: Ensure all important state transitions emit events
* **Balance detail and volume**: Emit enough events for visibility without overwhelming storage
* **Consider event consumers**: Design with reporting, monitoring, and analysis needs in mind
* **Document event types**: Maintain clear documentation of all events and their meanings
**Implementation approach**:
```
Event Naming Structure:
[domain].[entity].[action]
Examples:
- tool.request.initiated
- order.payment.processed
- user.profile.updated
- system.resource.allocated
```
Create filtering strategies for efficient data access.
**Recommendations**:
* **Use consistent metadata**: Add standard fields like request IDs to enable correlation
* **Include categorization data**: Add tags, types, and categories for efficient filtering
* **Consider time-based access**: Optimize for common time-range queries
* **Balance filter granularity**: Too granular filters can be as problematic as too broad ones
* **Test filter performance**: Ensure filtering is efficient at production scale
**Example filtering approach**:
```javascript theme={null}
// Effective event filtering
const events = await activity.queryEvents({
// Time range
timeRange: {
start: new Date(Date.now() - (7 * 24 * 60 * 60 * 1000)), // 7 days ago
end: new Date()
},
// Event types (using hierarchical pattern)
eventTypes: ['tool.execution.*', 'tool.error.*'],
// Source filter
sources: ['workspace:customer-service'],
// Metadata filters
filters: [
{ field: 'data.requestId', operator: 'eq', value: 'req-123456' },
{ field: 'data.toolName', operator: 'in', value: ['CustomerLookup', 'OrderStatus'] }
],
// Sorting
sort: { field: 'timestamp', direction: 'desc' },
// Pagination
limit: 100,
offset: 0
});
```
Ensure your activity management scales with usage.
**Recommendations**:
* **Implement data lifecycle management**: Archive older events to control storage growth
* **Consider sampling for high-volume events**: For very frequent events, consider sampling
* **Optimize query patterns**: Design queries to use available indexes
* **Leverage aggregation**: Use pre-aggregated metrics for frequent analyses
* **Plan for growth**: Design with future scale in mind
**Example lifecycle implementation**:
```yaml theme={null}
slug: activity-lifecycle-management
when:
schedule: '0 0 * * *' # Daily at midnight
do:
# Archive events older than 30 days
- activity.archiveEvents:
olderThan: '{{date.add(now(), -30, "days")}}'
destination: 'cold-storage'
# Delete archived events older than 365 days
- activity.deleteArchivedEvents:
olderThan: '{{date.add(now(), -365, "days")}}'
# Aggregate metrics for retention
- activity.aggregateMetrics:
timeRange:
start: '{{date.add(now(), -2, "days")}}'
end: '{{date.add(now(), -1, "days")}}'
dimensions: ['toolName', 'hour', 'errorType']
metrics: ['count', 'avgDuration', 'errorRate']
# Emit completion event
- emit:
event: system.activity.lifecycle.completed
data:
timestamp: '{{now()}}'
```
## Activity in AI Knowledge
For AI Knowledge users, Activity information is accessible through built-in interfaces:
Find the Activity section in AI Knowledge.
Key features:
* Chronological event listing
* Filtering by event type and date
* Search capabilities
* Drill-down for details
Track how agents are using tools.
Available information:
* Tool usage frequency
* Success and error rates
* Performance metrics
* Parameter patterns
Examine how tools integrate into conversations.
Analysis capabilities:
* Tool usage in conversation context
* User reactions to tool results
* Multi-turn tool interactions
* Conversation paths and patterns
Extract data for external analysis.
Export options:
* CSV for spreadsheet analysis
* JSON for programmatic processing
* Filtered or complete data sets
* Custom date ranges
## Next Steps
Ready to implement effective execution monitoring and activity tracking? Continue with these resources:
Learn how to implement robust error management
Explore the event system in greater depth